Delivery Intelligence

Achieve Operational Excellence
in Software Delivery

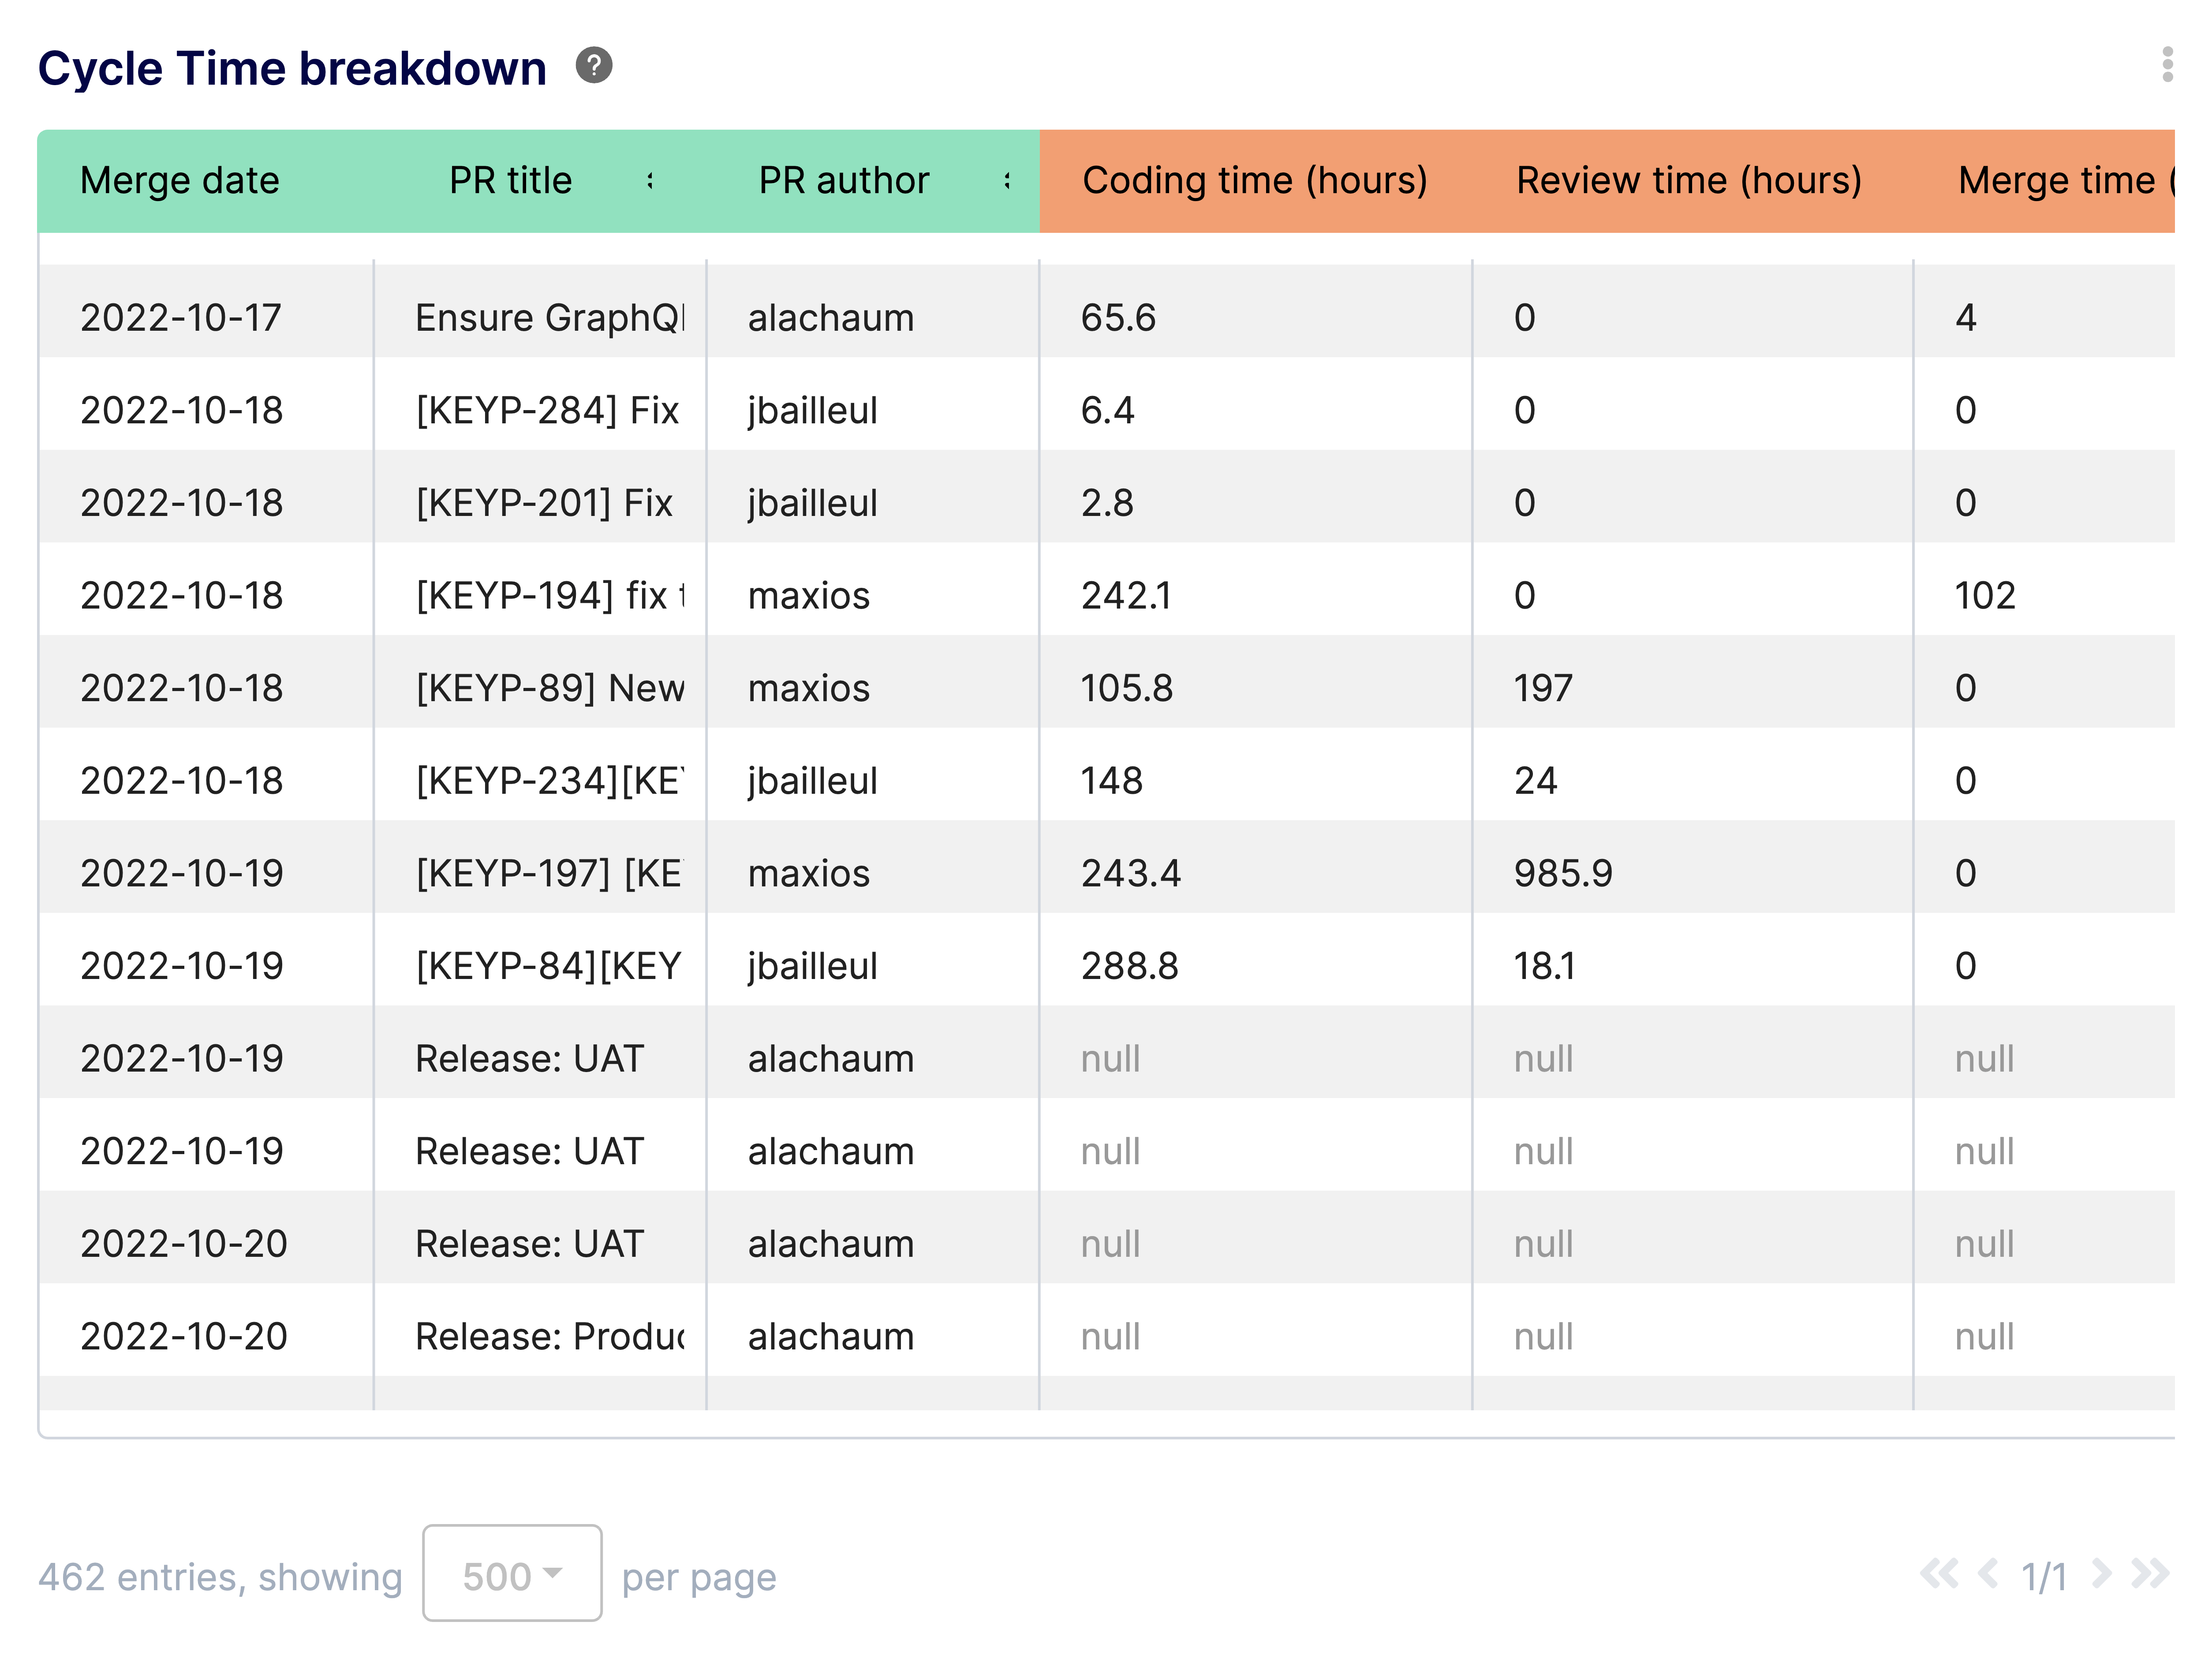
Stop guessing where your pipeline is slow. Balance speed and stability with real-time DORA metrics, cycle time analysis, and bottleneck detection. Shift from average to elite.

Operational Excellence Dashboard
🚀
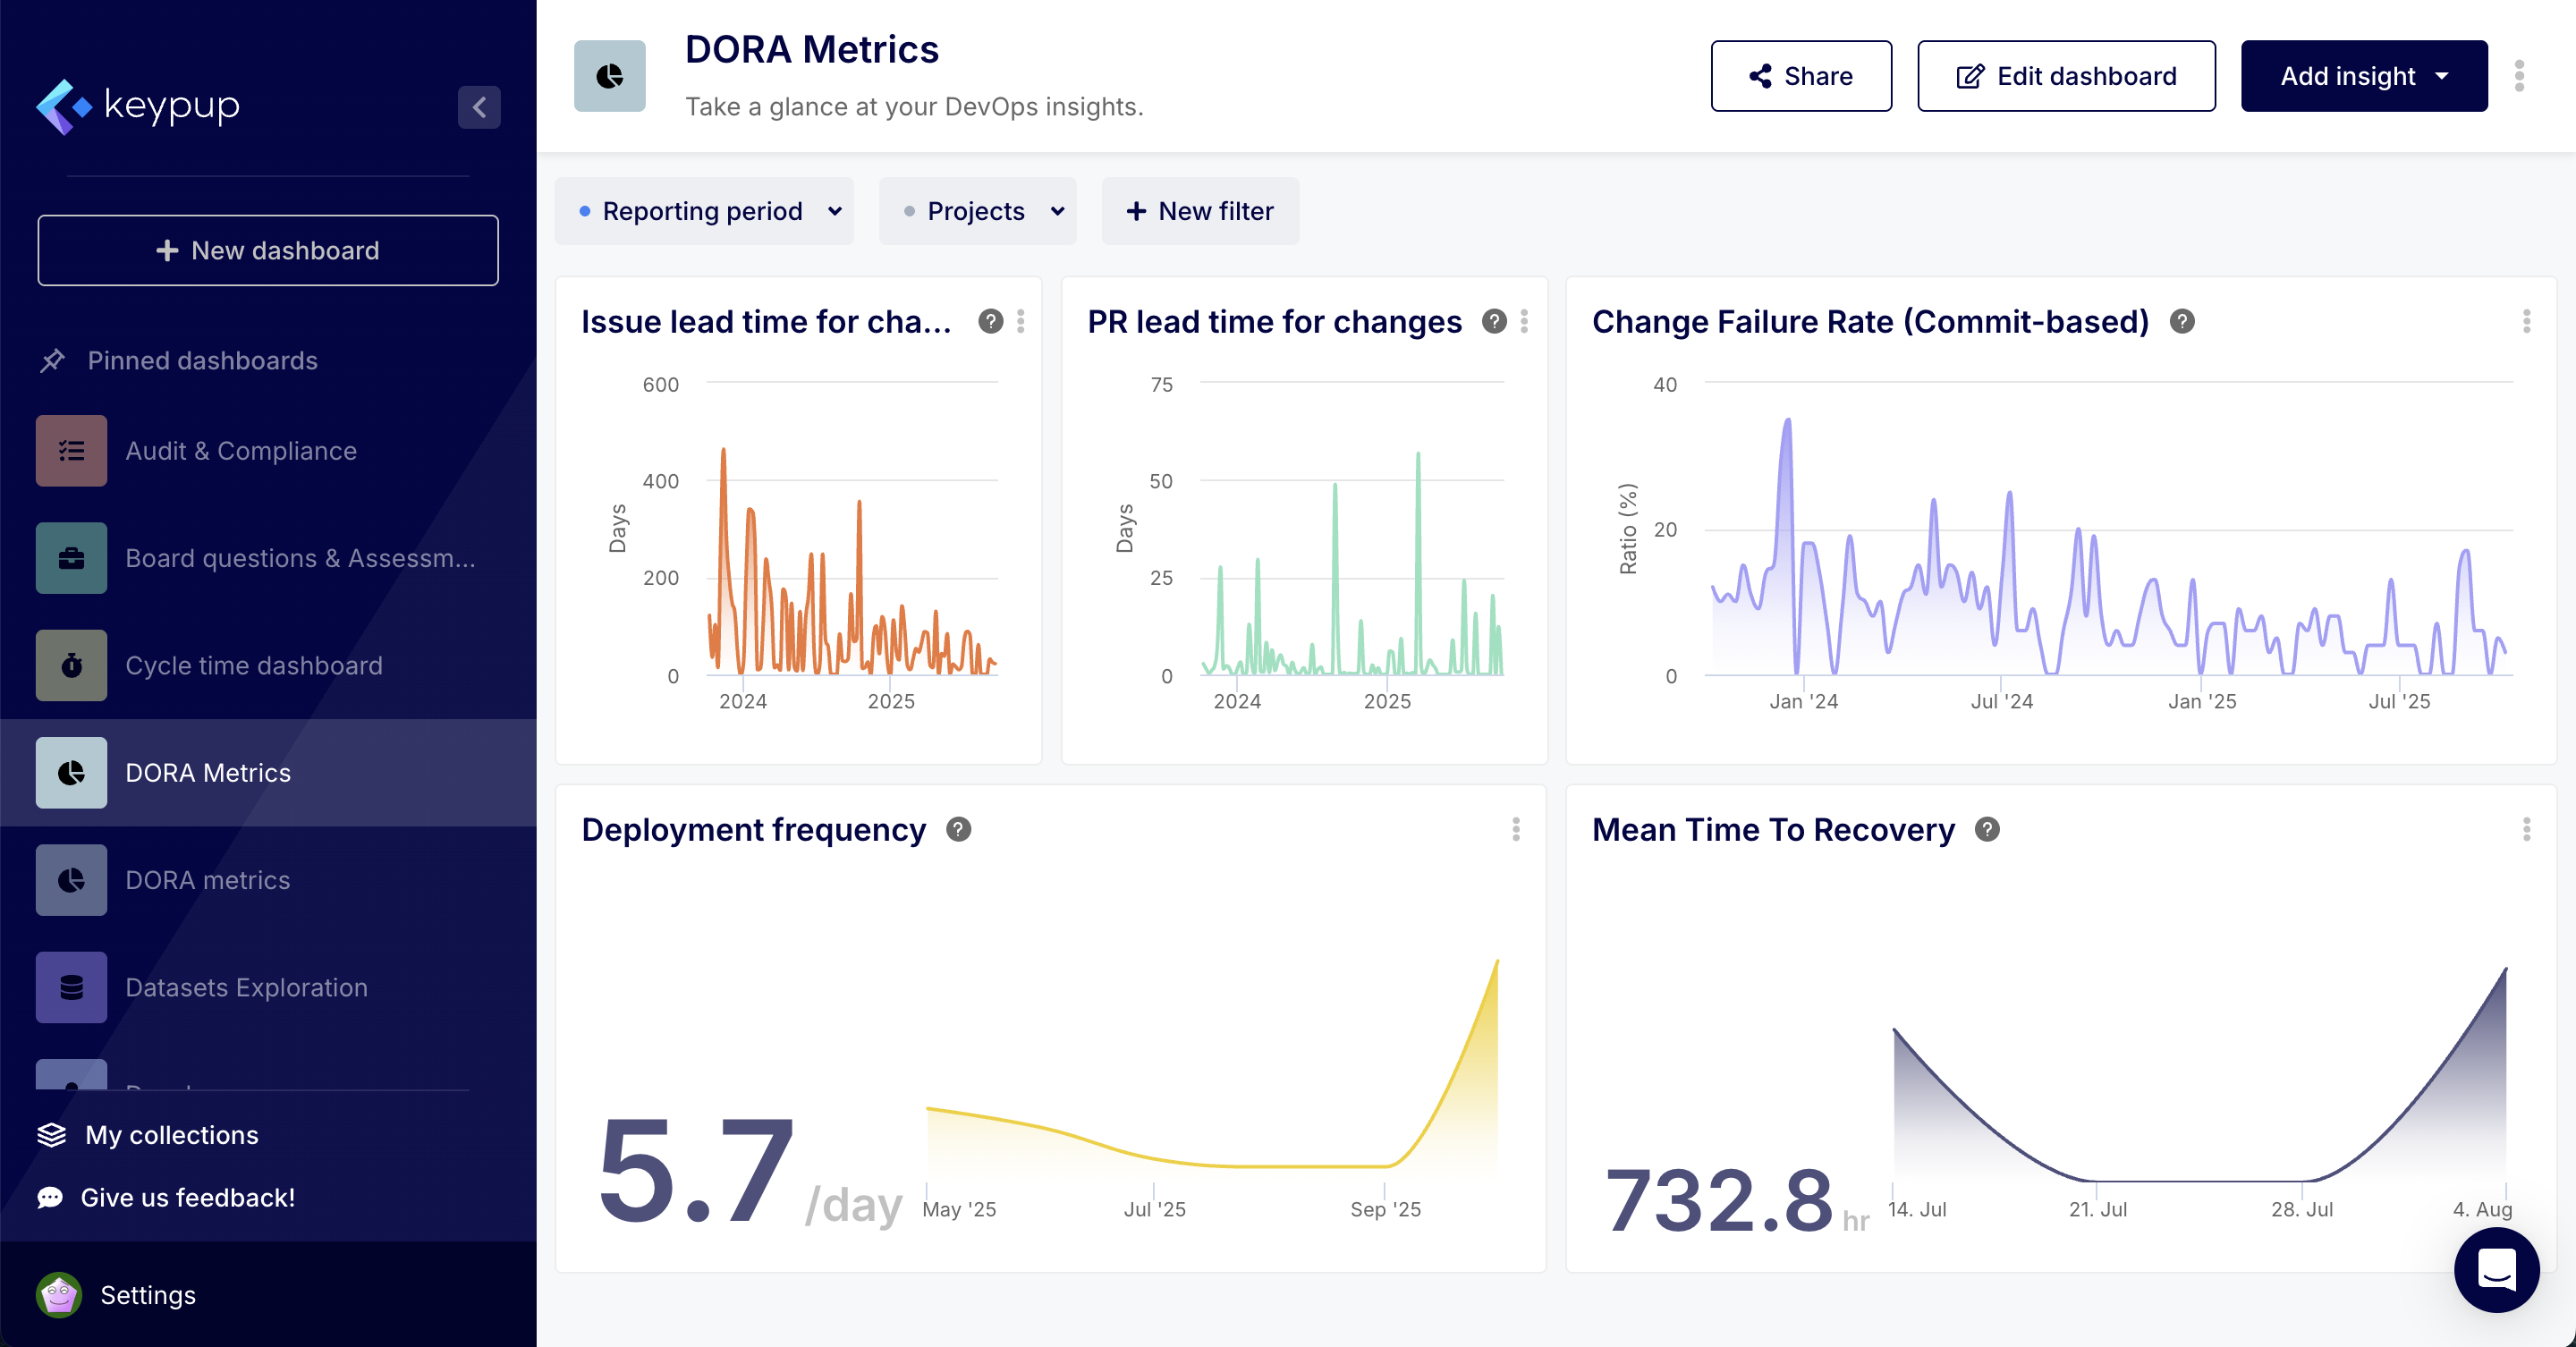
Deployment Freq. On Demand
✓
Change Failure < 5%
TRUSTED BY ENGINEERING LEADERS AT

The Barriers to Elite Performance

What's preventing your team from shipping faster and safer?

Hidden Bottlenecks

Invisible delays in Code Review and QA slow down the entire release train without anyone noticing.

Unstable Releases

Pushing for speed often breaks stability. Without tracking Change Failure Rate, quality suffers.

Lack of Visibility

Fragmented data between Git and Jira makes it impossible to see the true "Lead Time" of a feature.

The Performance Suite

9 Metrics to Drive Delivery Excellence

Keypup unifies your engineering data into three pillars of excellence: DORA Metrics, Pipeline Velocity, and Team Throughput.

DORA Metrics Dashboard
DORA Metrics: Speed vs Stability
Pull Request Cycle Time
Detailed Cycle Time Breakdown
Deployment Trends
Deployment Frequency Trends
1

Deployment Frequency

Measure how often successful releases to production occur. Aim for "On Demand".

2

Lead Time for Changes

Track the time from code commit to code successfully running in production.

3

Change Failure Rate

Percentage of deployments causing a failure in production.

4

Mean Time to Restore

How long it takes to recover from a failure in production.

5

PR Cycle Time

Identify slow reviews or long-running tests stalling your merge process.

6

Merge Frequency

The heartbeat of your team. Track the volume of code being integrated daily.

7

Time to First Review

Are PRs sitting idle? Measure the wait time before a review starts.

8

Build Success Rate

Correlate pipeline stability with development velocity.

9

Issue Throughput

Measure the velocity of tickets moving from "In Progress" to "Done".

Trusted by Engineering Leaders

See why modern development teams rely on Keypup to ship faster.

"Keypup gave us visibility we didn't know we were missing. We cut our Pull Request review time by 40% in just two weeks. It's now the first tab I open in the morning."

"Finally, a tool that connects DORA metrics to actual developer actions. The reporting automation alone saves our managers 5 hours a week per squad."

"The custom dashboard builder is a game changer. We were able to visualize our specific workflow bottlenecks that other out-of-the-box tools completely missed."

"Implementing Keypup helped us foster a culture of transparency. Developers don't feel monitored; they feel empowered with data to improve their own work."

Ready to optimize your delivery pipeline?

Connect your repositories and project boards to get your Delivery metrics in minutes.